Hamilton East—Stoney Creek (provincial electoral district)
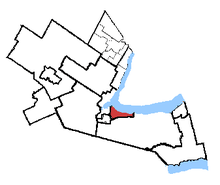 Hamilton East—Stoney Creek in relation to the other Hamilton area ridings | |||
| Provincial electoral district | |||
| Legislature | Legislative Assembly of Ontario | ||
| MPP |
| ||
| District created | 2006 | ||
| First contested | 2007 | ||
| Last contested | 2014 | ||
| Demographics | |||
| Population (2006) | 116,434 | ||
| Electors (2011) | 85,802 | ||
| Area (km²) | 74 | ||
| Pop. density (per km²) | 1,573.4 | ||
| Census divisions | Hamilton | ||
| Census subdivisions | Hamilton | ||
Hamilton East—Stoney Creek is a provincial electoral district in Ontario, Canada, that has been represented in the Legislative Assembly of Ontario since the 2007 provincial election.
The riding was formed in 2003 from parts of the former ridings of Hamilton East and Stoney Creek.
Of the 115,709 constituents of the riding, a slight majority were previously constituents in the former riding of Stoney Creek. 58,462 constituents were part of the Stoney Creek riding while 57,247 constituents originated from Hamilton East.
Geography
It consists of the part of the City of Hamilton lying north of the Niagara Escarpment and east of Ottawa Street.
The riding consists of the neighbourhoods of Bartonville, Homeside, Normanhurst, McQuesten, Glenview, Rosedale, Red Hill, Vincent, Gershome, Greenford, Corman, Kentley, Riverdale, Parkview West, Parkview East, Nashdale, Lake Grayside and the eastern half of The Delta in the former City of Hamilton plus the part of the former City of Stoney Creek north of the Niagara Escarpment including the "Old Town", Fruitland and Winona.
Members of Provincial Parliament
| Hamilton East—Stoney Creek | ||||
|---|---|---|---|---|
| Assembly | Years | Member | Party | |
| Riding created from Hamilton East and Stoney Creek | ||||
| 39th | 2007–2011 | Paul Miller | New Democratic | |
| 40th | 2011–2014 | |||
| 41st | 2014–Present | |||
Election results
| Ontario general election, 2014 | ||||||||
|---|---|---|---|---|---|---|---|---|
| Party | Candidate | Votes | % | ∆% | ||||
| New Democratic | Paul Miller | 19,958 | 46.81 | -4.91 | ||||
| Liberal | Ivan Luksic | 12,433 | 29.16 | +2.86 | ||||
| Progressive Conservative | David Brown | 7,574 | 17.76 | -0.95 | ||||
| Green | Greg Zink | 1,742 | 4.09 | +2.34 | ||||
| Libertarian | Mark Burnison | 676 | 1.59 | +0.84 | ||||
| Freedom | Britney Anne Johnston | 254 | 0.60 | +0.26 | ||||
| Total valid votes | 42,637 | 100.0 | ||||||
| New Democratic hold | Swing | -3.88 | ||||||
| Source: Elections Ontario[1] | ||||||||
| Ontario general election, 2011 | ||||||||
|---|---|---|---|---|---|---|---|---|
| Party | Candidate | Votes | % | ∆% | ||||
| New Democratic | Paul Miller | 20,442 | 51.72 | +14.09 | ||||
| Liberal | Mark Cripps | 10,397 | 26.30 | -8.82 | ||||
| Progressive Conservative | Nancy Fiorintino | 7,395 | 18.71 | -2.57 | ||||
| Green | W. Peter Randall | 692 | 1.75 | -3.19 | ||||
| Libertarian | Greg Pattinson | 295 | 0.75 | |||||
| Family Coalition | Bob Green Innes | 173 | 0.44 | -0.6 | ||||
| Freedom | Philip Doucette | 133 | 0.34 | |||||
| Total valid votes | 39,527 | 100.00 | ||||||
| Total rejected, unmarked and declined ballots | 216 | 0.54 | ||||||
| Turnout | 39,743 | 46.26 | ||||||
| Eligible voters | 85,908 | |||||||
| New Democratic hold | Swing | +11.46 | ||||||
| Source: Elections Ontario[2] | ||||||||
| Ontario general election, 2007 | ||||||||
|---|---|---|---|---|---|---|---|---|
| Party | Candidate | Votes | % | |||||
| New Democratic | Paul Miller | 16,256 | 37.63 | |||||
| Liberal | Nerene Virgin | 15,171 | 35.12 | |||||
| Progressive Conservative | Tara Crugnale | 9,195 | 21.28 | |||||
| Green | Raymond Dartsch | 2,122 | 4.91 | |||||
| Family Coalition | Robert Innes | 451 | 1.04 | |||||
| Total valid votes | 43,195 | 100.0 | ||||||
2007 electoral reform referendum
| Ontario electoral reform referendum, 2007 | |||
|---|---|---|---|
| Side | Votes | % | |
| First Past the Post | 23,342 | 63.7 | |
| Mixed member proportional | 13,310 | 36.3 | |
| Total valid votes | 36,652 | 100.0 | |
Sources
- ↑ Elections Ontario (2014). "Official result from the records, 032 Hamilton East—Stoney Creek" (PDF). Retrieved 27 June 2015.
- ↑ Elections Ontario (2011). "Official return from the records / Rapport des registres officiels - Hamilton East—Stoney Creek" (PDF). Retrieved 3 June 2014.
Coordinates: 43°15′04″N 79°48′14″W / 43.251°N 79.804°W