Camden London Borough Council election, 2014
| ||||||||||||||||||||||||||||||||||||||||||||||||||||||||||||||||||||||||||||||
| ||||||||||||||||||||||||||||||||||||||||||||||||||||||||||||||||||||||||||||||
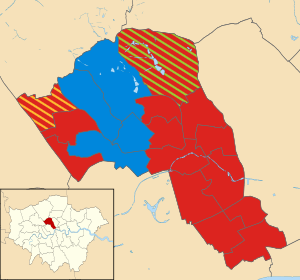
Map of the results of the 2014 Camden council election. Conservatives in blue, Greens in green, Labour in red and Liberal Democrats in yellow.
The 2014 Camden Council election took place on 22 May 2014 to elect members of Camden Council in England.[1] This was on the same day as other local elections.
Results
| Camden Local Election Result 2014[2] | ||||||||||
|---|---|---|---|---|---|---|---|---|---|---|
| Party | Seats | Gains | Losses | Net gain/loss | Seats % | Votes % | Votes | +/− | ||
| Labour | 40 | 10 | 0 | +10 | 74.07% | 45.78% | 77,502 | +12.28 | ||
| Conservative | 12 | 2 | 0 | +2 | 22.22% | 22.32% | 37,781 | -4.18 | ||
| Green | 1 | 0 | 0 | 0 | 1.85% | 15.69% | 26,556 | +4.79 | ||
| Liberal Democrat | 1 | 0 | 12 | -12 | 1.85% | 14.68% | 24,851 | -13.92 | ||
| UKIP | 0 | 0 | 0 | 0 | 0.00% | 1.05% | 1,774 | +0.95 | ||
| Independent | 0 | 0 | 0 | 0 | 0.00% | 0.38% | 648 | +0.28 | ||
| TUSC | 0 | 0 | 0 | 0 | 0.00% | 0.10% | 177 | +0.1 | ||
Ward results
| Party | Candidate | Votes | % | ± | |
|---|---|---|---|---|---|
| Conservative | Jonny Bucknell | 1,219 | |||
| Conservative | Claire-Louise Leyland | 1,157 | |||
| Conservative | Leila Roy | 1,016 | |||
| Liberal Democrat | Tom Simon | 992 | |||
| Labour | Madeleine Jennings | 939 | |||
| Labour | James McGowan | 782 | |||
| Liberal Democrat | Bradley Hillier-Smith | 760 | |||
| Labour | Harunur Rashid | 709 | |||
| Liberal Democrat | Lawrence Joseph Nicholson | 678 | |||
| Green | Rowan St Clair | 275 | |||
| Green | Darren Robert Murphy | 269 | |||
| Green | Stuart Temple Taylor | 243 | |||
| Independent | Nigel Rumble | 199 | |||
| Turnout | 9,257 | 38.3 | -24.0 | ||
| Conservative hold | Swing | ||||
| Conservative hold | Swing | ||||
| Conservative gain from Liberal Democrat | Swing | ||||
| Party | Candidate | Votes | % | ± | |
|---|---|---|---|---|---|
| Labour | Adam Harrison | 1,295 | |||
| Labour | Sabrina Francis | 1,271 | |||
| Labour | Rishi Madlani | 1,226 | |||
| Conservative | Timothy Barnes | 608 | |||
| Conservative | Andrew Keep | 536 | |||
| Conservative | Sarah Macken | 489 | |||
| Green | Dee Searle | 419 | |||
| Green | Samuel William Gage | 396 | |||
| Green | Shana Tufail | 341 | |||
| UKIP | Giles Game | 219 | |||
| Liberal Democrat | Aimery De Malet | 212 | |||
| Liberal Democrat | Hammad Baig | 185 | |||
| Liberal Democrat | Stanley Grossman | 167 | |||
| Turnout | 7,385 | 33.1 | |||
| Labour hold | Swing | ||||
| Labour hold | Swing | ||||
| Labour hold | Swing | ||||
| Party | Candidate | Votes | % | ± | |
|---|---|---|---|---|---|
| Labour | Pat Callaghan | 2,005 | |||
| Labour | Lazzaro Pietragnoli | 1,608 | |||
| Labour | Richard Cotton | 1,542 | |||
| Conservative | Rory Manley | 655 | |||
| Green | Nicola Hart | 641 | |||
| Conservative | Chris Kassapis | 609 | |||
| Green | Daniel Alexander Rosenbaum | 601 | |||
| Conservative | Richard James Merrin | 567 | |||
| Green | Ben Van Der Velde | 455 | |||
| Liberal Democrat | Sarah Hoyle | 309 | |||
| Liberal Democrat | Juniour Blake | 295 | |||
| Independent | Phil Cowan | 287 | |||
| Liberal Democrat | Mukul Hira | 255 | |||
| Turnout | 9,847 | 38.0 | |||
| Labour hold | Swing | ||||
| Labour hold | Swing | ||||
| Labour gain from Liberal Democrat | Swing | ||||
| Party | Candidate | Votes | % | ± | |
|---|---|---|---|---|---|
| Labour | Danny Beales | 2,002 | |||
| Labour | Phil Jones | 1,966 | |||
| Labour | Angela Mason | 1,899 | |||
| Liberal Democrat | Paul Braithwaite | 725 | |||
| Green | Fran Bury | 639 | |||
| Green | Fiona Ann Firman | 632 | |||
| Green | Victoria Green | 546 | |||
| Conservative | Robyn Gardner | 375 | |||
| Conservative | Robert Anthony Ricketts | 361 | |||
| Liberal Democrat | Margaret Jackson-Roberts | 355 | |||
| Conservative | Will Timmins | 346 | |||
| Liberal Democrat | Catherine Felicity Jane Sinclair Jones | 344 | |||
| Turnout | 10,221 | 40.6 | |||
| Labour hold | Swing | ||||
| Labour hold | Swing | ||||
| Labour gain from Liberal Democrat | Swing | ||||
| Party | Candidate | Votes | % | ± | |
|---|---|---|---|---|---|
| Liberal Democrat | Flick Rea | 1,151 | |||
| Labour | Lorna Russell | 1,028 | |||
| Labour | Richard Olszewski | 967 | |||
| Liberal Democrat | Nancy Jirira | 950 | |||
| Labour | Phil Turner | 904 | |||
| Conservative | Ian Cohen | 893 | |||
| Liberal Democrat | Nick Russell | 865 | |||
| Conservative | Andrew James Parkinson | 739 | |||
| Conservative | Tom Smith | 686 | |||
| Green | Leila Mars | 403 | |||
| Green | Juan Jimenez | 326 | |||
| Green | Lucy Oldfield | 318 | |||
| Turnout | 9246 | 39.2 | |||
| Liberal Democrat hold | Swing | ||||
| Labour gain from Liberal Democrat | Swing | ||||
| Labour gain from Liberal Democrat | Swing | ||||
| Party | Candidate | Votes | % | ± | |
|---|---|---|---|---|---|
| Conservative | Siobhan Baillie | 1,497 | |||
| Conservative | Andrew Mennear | 1,428 | |||
| Conservative | Gio Spinella | 1,352 | |||
| Labour | Jack Boardman | 606 | |||
| Labour | Richard Salmon | 512 | |||
| Labour | Mazida Khatun | 481 | |||
| Green | Charles Harris | 411 | |||
| Green | Edward Ross | 363 | |||
| Green | Stephen West | 312 | |||
| Liberal Democrat | David Ian Bouchier | 294 | |||
| Liberal Democrat | Anne Ward | 284 | |||
| Liberal Democrat | Erich Wagner | 187 | |||
| Turnout | 7,738 | 33.7 | |||
| Conservative hold | Swing | ||||
| Conservative hold | Swing | ||||
| Conservative hold | Swing | ||||
| Party | Candidate | Votes | % | ± | |
|---|---|---|---|---|---|
| Labour | Theo Blackwell | 1,687 | |||
| Labour | Maeve McCormack | 1,590 | |||
| Labour | Larraine Revah | 1,534 | |||
| Conservative | Steve Adams | 634 | |||
| Conservative | Peter Horne | 551 | |||
| Green | Jane Walby | 549 | |||
| Green | Constantin Buhayer | 527 | |||
| Conservative | Sangita Singh | 456 | |||
| Green | James Marshall | 429 | |||
| UKIP | Barry Leavers | 361 | |||
| Liberal Democrat | Roger Hughes | 248 | |||
| Liberal Democrat | Laura Frances Noel | 245 | |||
| Liberal Democrat | Kevin Simon Sefton | 158 | |||
| TUSC | John Reid | 110 | |||
| Turnout | |||||
| Labour hold | Swing | ||||
| Labour hold | Swing | ||||
| Labour hold | Swing | ||||
| Party | Candidate | Votes | % | ± | |
|---|---|---|---|---|---|
| Conservative | Simon Marcus | 1,465 | |||
| Conservative | Stephen Stark | 1,380 | |||
| Conservative | Tom Currie | 1,272 | |||
| Liberal Democrat | Linda Chung | 1,148 | |||
| Labour | Rachael Agnew | 726 | |||
| Labour | Maddy Raman | 711 | |||
| Labour | Luca Salice | 609 | |||
| Liberal Democrat | James Newsome | 575 | |||
| Liberal Democrat | Robert Carruthers | 542 | |||
| Green | Sophie Emma Clare Dix | 512 | |||
| Green | Maisie King | 365 | |||
| Green | Prashant Vaze | 288 | |||
| Turnout | 9,604 | 43.7 | |||
| Conservative hold | Swing | ||||
| Conservative gain from Liberal Democrat | Swing | ||||
| Conservative hold | Swing | ||||
| Party | Candidate | Votes | % | ± | |
|---|---|---|---|---|---|
| Labour | Alison Kelly | 1,707 | |||
| Labour | Abdul Quadir | 1,578 | |||
| Labour | Abi Wood | 1,462 | |||
| Liberal Democrat | Jill Fraser | 1,081 | |||
| Liberal Democrat | Matt Sanders | 976 | |||
| Liberal Democrat | Rahel Mohammed Bokth | 913 | |||
| Green | Charlotte Collins | 456 | |||
| Green | Una Sapietis | 361 | |||
| Green | Andre Lopez-Turner | 356 | |||
| Conservative | Stephen Daughton | 351 | |||
| Conservative | Nathan Davidson | 339 | |||
| UKIP | Christopher Cooke | 315 | |||
| Conservative | Carole Ricketts | 291 | |||
| Turnout | 10,206 | 42.5 | |||
| Labour gain from Liberal Democrat | Swing | ||||
| Labour gain from Liberal Democrat | Swing | ||||
| Labour gain from Liberal Democrat | Swing | ||||
| Party | Candidate | Votes | % | ± | |
|---|---|---|---|---|---|
| Labour | Sally Gimson | 1,739 | |||
| Labour | Oliver Lewis | 1,664 | |||
| Green | Siân Berry | 1,642 | |||
| Labour | Valerie Leach | 1,567 | |||
| Green | Matthew Johnston | 1,252 | |||
| Green | Robert McCracken | 1,099 | |||
| Conservative | Beth Charlesworth | 763 | |||
| Conservative | Will Blair | 727 | |||
| Conservative | Will Dilnott-Cooper | 662 | |||
| Liberal Democrat | Henry Potts | 232 | |||
| Liberal Democrat | Martin Charles Hay | 198 | |||
| Liberal Democrat | Martin Wright | 130 | |||
| Turnout | 11,702 | 50.0 | |||
| Labour hold | Swing | ||||
| Labour hold | Swing | ||||
| Green hold | Swing | ||||
| Party | Candidate | Votes | % | ± | |
|---|---|---|---|---|---|
| Labour | Julian Fulbrook | 1,844 | |||
| Labour | Sue Vincent | 1,714 | |||
| Labour | Awale Olad | 1,588 | |||
| Conservative | Alison Frost | 635 | |||
| Conservative | Lewis Barber | 601 | |||
| Conservative | Daniel Nesbitt | 576 | |||
| Green | Niki Brain | 480 | |||
| Green | Eve Mullen | 458 | |||
| Green | Anthony Quinn | 357 | |||
| Liberal Democrat | Jeremy Richard Allen | 222 | |||
| Liberal Democrat | David Simmons | 196 | |||
| Liberal Democrat | Ken Wright | 181 | |||
| Independent | Robert Carlyle | 162 | |||
| Turnout | 9,046 | 35.5 | |||
| Labour hold | Swing | ||||
| Labour hold | Swing | ||||
| Labour hold | Swing | ||||
| Party | Candidate | Votes | % | ± | |
|---|---|---|---|---|---|
| Labour | Jenny Headlam-Wells | 2,165 | |||
| Labour | Georgia Gould | 2,076 | |||
| Labour | Meric Apak | 1,992 | |||
| Green | Jack Parker | 882 | |||
| Green | Alaa Owaineh | 818 | |||
| Green | George Houghton | 738 | |||
| Conservative | Doreen Bartlett | 452 | |||
| Conservative | Darryl Davies | 427 | |||
| Conservative | Paul Barton | 397 | |||
| Liberal Democrat | Judy Dixey | 375 | |||
| Liberal Democrat | Omar Ali | 304 | |||
| UKIP | Maxine Spencer | 287 | |||
| Liberal Democrat | Valdir Francisco | 195 | |||
| Turnout | 11,128 | 40.8 | |||
| Labour hold | Swing | ||||
| Labour hold | Swing | ||||
| Labour hold | Swing | ||||
| Party | Candidate | Votes | % | ± | |
|---|---|---|---|---|---|
| Labour | Douglas Beattie | 1,661 | |||
| Labour | Maryam Eslamdoust | 1,611 | |||
| Labour | Thomas Gardiner | 1,543 | |||
| Liberal Democrat | James King | 883 | |||
| Liberal Democrat | Janet Grauberg | 876 | |||
| Liberal Democrat | Jack Holroyde | 746 | |||
| Conservative | Nick Vose | 411 | |||
| Conservative | Tim Wainwright | 409 | |||
| Green | Sarah Astor | 402 | |||
| Conservative | John Whitehead | 357 | |||
| Green | Sheila Hayman | 286 | |||
| Green | Richard Bourn | 276 | |||
| Turnout | 9,483 | 38.3% | |||
| Labour hold | Swing | ||||
| Labour hold | Swing | ||||
| Labour hold | Swing | ||||
| Party | Candidate | Votes | % | ± | |
|---|---|---|---|---|---|
| Labour | Sarah Hayward | 1,467 | |||
| Labour | Abdul Hai | 1,424 | |||
| Labour | Jonathan Simpson | 1,333 | |||
| Green | Brian Gascoigne | 550 | |||
| Green | Dominic Kendrick | 459 | |||
| Green | Lewis Sullivan | 446 | |||
| Conservative | Adam Lester | 431 | |||
| Conservative | Ivan Massow | 403 | |||
| Conservative | Patsy Prince | 401 | |||
| Liberal Democrat | Elizabeth Jones | 263 | |||
| Liberal Democrat | Jon Burden | 236 | |||
| Liberal Democrat | Michael Skinner | 195 | |||
| Turnout | 7631 | 34.5 | |||
| Labour hold | Swing | ||||
| Labour hold | Swing | ||||
| Labour hold | Swing | ||||
| Party | Candidate | Votes | % | ± | |
|---|---|---|---|---|---|
| Labour | Heather Johnson | 1,675 | |||
| Labour | Nasim Ali | 1,648 | |||
| Labour | Nadia Shah | 1,599 | |||
| Conservative | Shahin Ahmed | 595 | |||
| Conservative | Hamish Hunter | 551 | |||
| Green | Daniel Jones | 525 | |||
| Conservative | Ellie Vesey-Thompson | 516 | |||
| Green | Stephen Plowden | 457 | |||
| Green | Nicholas Seston | 409 | |||
| UKIP | Barry Read | 380 | |||
| Liberal Democrat | Sam Cannicott | 232 | |||
| Liberal Democrat | Anne Wright | 198 | |||
| Liberal Democrat | Daviyani Rayshma Kothari | 133 | |||
| Turnout | 8,930 | 36.0% | |||
| Labour hold | Swing | ||||
| Labour hold | Swing | ||||
| Labour hold | Swing | ||||
| Party | Candidate | Votes | % | ± | |
|---|---|---|---|---|---|
| Labour | Roger Robinson | 2,511 | |||
| Labour | Peter Brayshaw | 2,488 | |||
| Labour | Samata Khatoon | 2,423 | |||
| Green | Matty Mitford | 562 | |||
| Green | James Widdowson | 526 | |||
| Green | Koonal Kirit Shah | 440 | |||
| Conservative | Rob Culligan | 368 | |||
| Conservative | Brian Rice | 351 | |||
| Conservative | Elliot Miller | 295 | |||
| Liberal Democrat | Abdul Hannan Tarofdar | 245 | |||
| Liberal Democrat | Nana Oye Adjepong | 192 | |||
| Liberal Democrat | Nicole Sykes | 178 | |||
| Turnout | 10,617 | 38.6 | |||
| Labour hold | Swing | ||||
| Labour hold | Swing | ||||
| Labour hold | Swing | ||||
| Party | Candidate | Votes | % | ± | |
|---|---|---|---|---|---|
| Conservative | Andrew Marshall | 1,340 | |||
| Conservative | Roger Freeman | 1,294 | |||
| Conservative | Don Williams | 1,221 | |||
| Labour | Ben Nunn | 1,029 | |||
| Labour | Simon Pearson | 1,008 | |||
| Labour | Gretel Reynolds | 960 | |||
| Green | Tom Franklin | 433 | |||
| Green | Helen Jack | 367 | |||
| Liberal Democrat | Jill Newbrook | 347 | |||
| Green | Sheila Patton | 339 | |||
| Liberal Democrat | Chris Butler | 300 | |||
| Liberal Democrat | Andrew Haslam-Jones | 230 | |||
| Turnout | 8,886 | 34.7 | |||
| Conservative hold | Swing | ||||
| Conservative hold | Swing | ||||
| Conservative hold | Swing | ||||
| Party | Candidate | Votes | % | ± | |
|---|---|---|---|---|---|
| Labour | Phil Rosenberg | 1,179 | |||
| Labour | Angela Pober | 1,166 | |||
| Labour | James Yarde | 1,082 | |||
| Liberal Democrat | Keith Moffitt | 943 | |||
| Liberal Democrat | Gillian Risso-Gill | 901 | |||
| Liberal Democrat | John Bryant | 836 | |||
| Conservative | Nick Grierson | 811 | |||
| Conservative | Natalie Eliades | 800 | |||
| Conservative | Andrew Saywell | 715 | |||
| Green | Zane Hannan | 343 | |||
| Green | Richard Griffiths | 327 | |||
| Green | Quentin Tyler | 250 | |||
| UKIP | Magnus Nielsen | 202 | |||
| TUSC | David Pearce | 67 | |||
| Turnout | 9,622 | 38.0 | |||
| Labour gain from Liberal Democrat | Swing | ||||
| Labour gain from Liberal Democrat | Swing | ||||
| Labour gain from Liberal Democrat | Swing | ||||
References
- ↑ "England council results". BBC News. Retrieved 23 May 2014.
- ↑ "Local Election Results May 2014". www.camden.gov.uk. Camden Council. Retrieved 2014-06-22.
This article is issued from Wikipedia - version of the 3/31/2016. The text is available under the Creative Commons Attribution/Share Alike but additional terms may apply for the media files.